In this blog today, we will talk to you more about debugging in WordPress site, how to debug your WP site as well as introduce some plugin available for logging errors.
As you know, debugging is a necessary factor in your software development process since it helps you to find out and solve some errors having during and after software development. In order to have a clearer understanding of it as well as how to debug your WordPress Website, let’s take a look now!
Debugging in WordPress
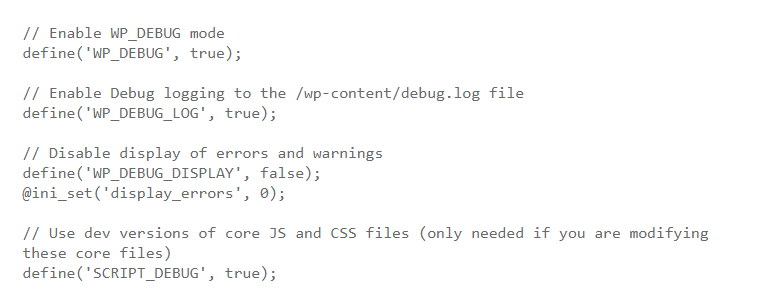
Debugging in WordPress is quite easy. It has a particular coding line that you can insert in your wp-config.php file which will allow debugging in a native manner. If you just only enable WP_DEBUG, it will bring all the error messages out on the screen as well as deter your browsing experience. For this reason, it will be better if you do not do it on a live website as well as log all your DEBUG logs into a different file. Let open your wp-config.php file and then detect a space where to place these following code links:
After putting the above code lines, let save and close the wp-config.php file that you have just edited. The whole of your debugging errors would be logged into a file at /wp-content/debug.log. This method that I have mentioned is easier than showing all errors in the admin dashboard or your own live site.
Several widgets for Debugging a WordPress site.
Now we will introduce to you another effective way to debug your WordPress site that is using a WordPress plugin or a browser extension. These days, there are hundreds of tools and debugging plugin in the market for you to choose from. But today we will list some of the most popular debug widgets that people usually use.
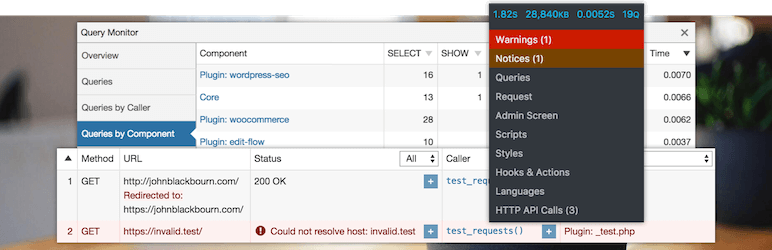
The first one I want to show you is the Query Monitor Plugin. By using it, you are able to debug REST API requests or redirects and AJAX calls as well. Besides, this plugin allows you to examine your filter hooks, database queries and find out PHP errors and so on. You can also get support from a couple of add-ons of other plugins like Debug Bar.
When you know the time each query needs to finish, you can save a lot of time when you optimize your site for maximum performance. Normally webmasters install a lot of plugins with a set of features; however, no one talks about the cost of those features, usually the server memory. Therefore, you need to choose carefully which plugins you need to install for your WP site.
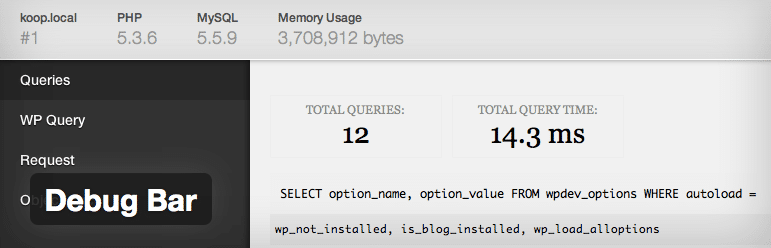
Inserting the Debug bar plugin for your site enables you to die deep into ins and outs of your PHP systems and MySQL. Thanks to it, you can completely understand how querries, data, and scripts interact with each other. Moreover, you can also realize what need to do to enhance and optimize the performance of your WordPress site.
Firebug Browser Add-on
This is the next tool that I want to introduce to you. By using this tool, developers, designers, as well as webmasters, are able to analyze their own site for design flaws, network issues, possible errors and the functional interaction among languages. If it has fewer errors, your site will load and respond much faster. The reason is that it still takes each error time to conduct and present itself. Moreover, when using this tool, you are able to log all errors in a single place to analyze and fix.
Log Deprecated Notices plugin is a great choice when you use deprecated files, function arguments or functions. This kind of plugin allows you to log and detect the deprecated code as well as provide you an alternation if possible. In addition, you will not need WP_DEBUG mode if you use this plugin.
WRAPPING UP:
We have just introduced some you some specific tools to debug a WordPress site. In particular, the Debug Bar plugin is the best choice because it can allow you to determine internal memory leaks as well as many other potential errors. Firebug plugin will be suitable if you need to look at the outside of your WordPress site and the way that the external script and plugins make an effect on the appearance and performance of your site. Whereas, the Default WP_DEBUG mode is suitable enough for you to completely understand the errors of your site and what you need to do. External plugins like what I mentioned above just helps to make it more clear and fix some simple things.
All in all, it is what I want to introduce to you today. We hope that it can be useful for you to debug a WordPress site. Do not hesitate to leave a comment below if you have any questions. We will try to answer as soon as possible.
We're Content Marketing team from AgeThemes with 10+ years in open source and tech. Our mission is to deliver high-quality content tailored for users of open source CMS platforms, including Joomla and WordPress. We strive to empower our audience with valuable insights and resources to enhance their digital experiences.


")
")


?")


